Data Visualisation: The Skill That Changes Everything
Turning Complex Data into Clear Decisions
Why Data Visualization Is More Critical Than Ever
Today, I want to share why I believe data visualization has become an indispensable skill in our data-driven world.
While rendering data might seem like an optional step to some, effective visualization transforms raw, overwhelming datasets into clear, actionable insights. When data is properly processed and meaningfully presented, it provides precise and immediately understandable overviews that would otherwise remain buried in spreadsheets and databases.
The Power of Visual Transformation
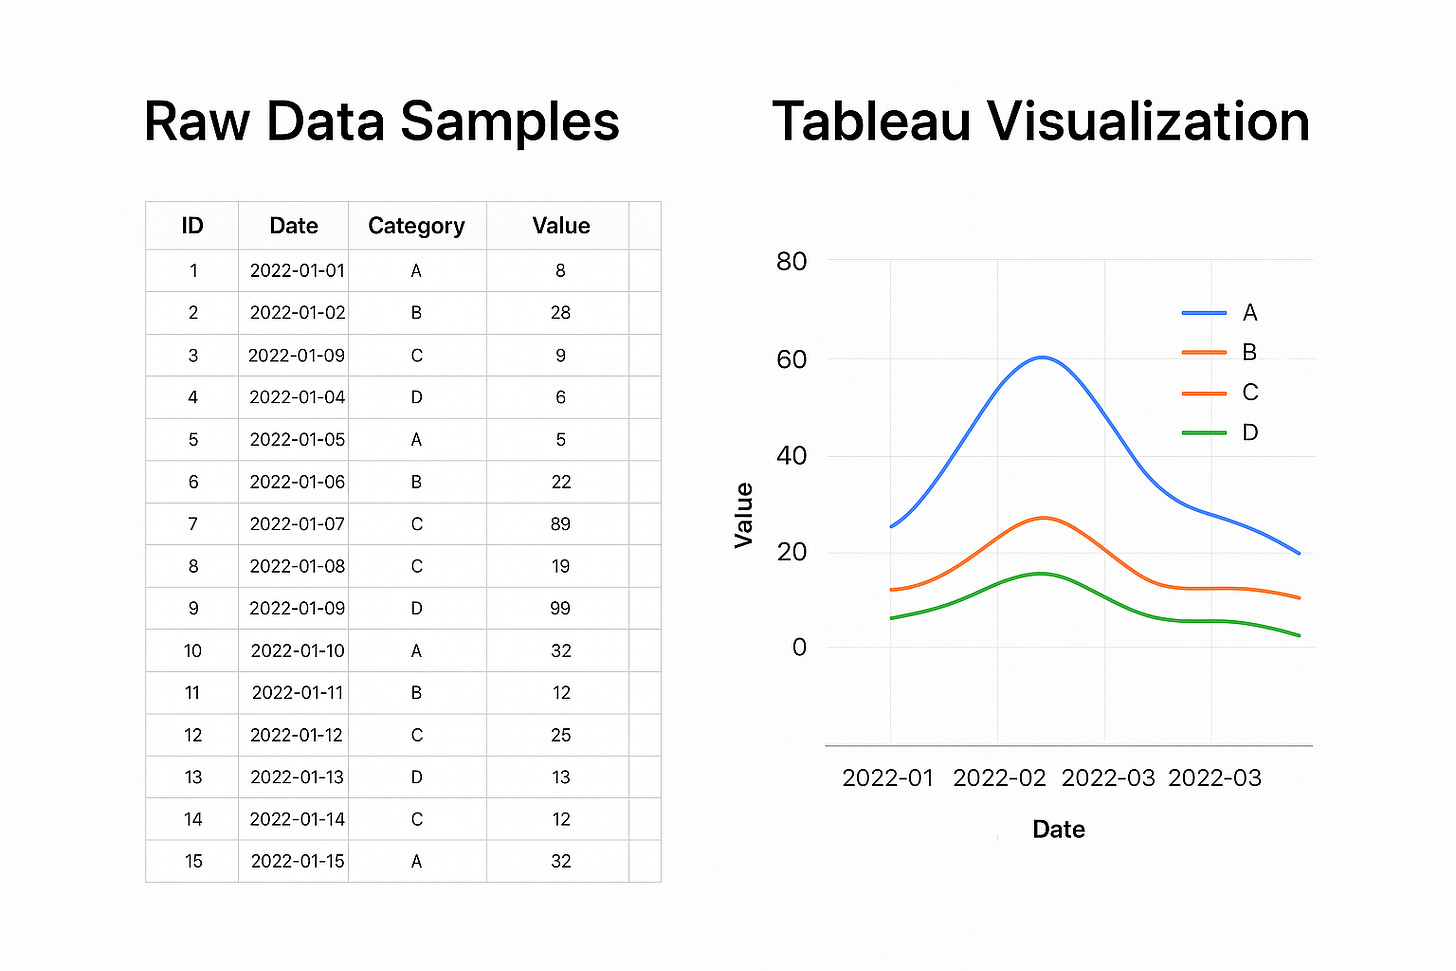
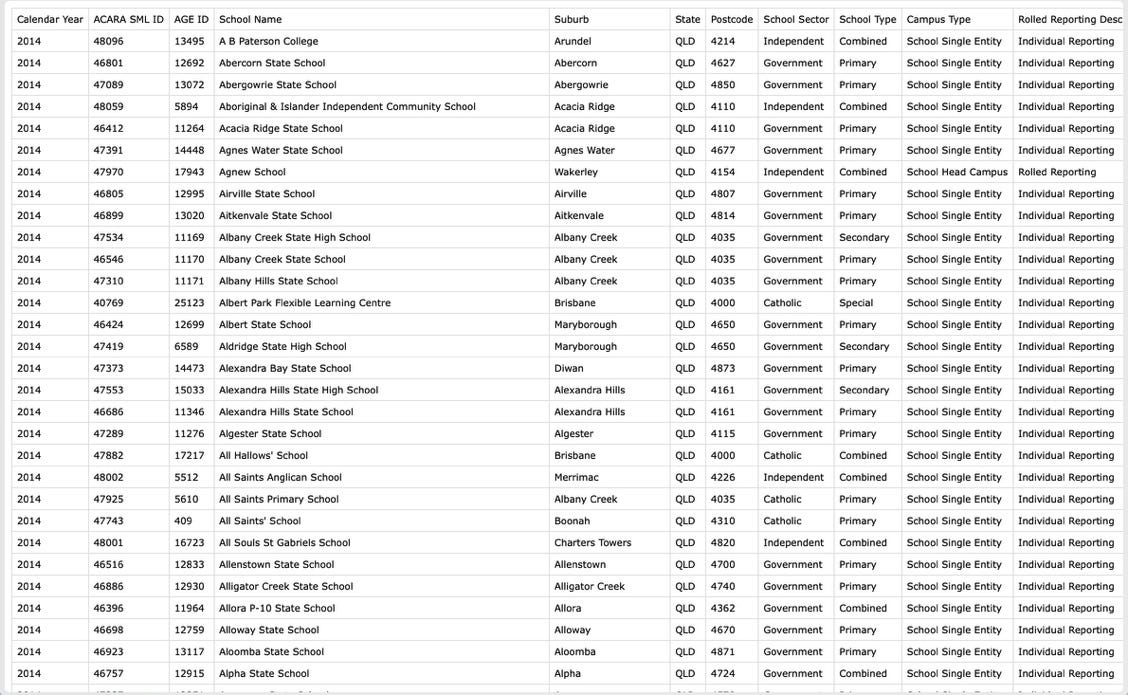
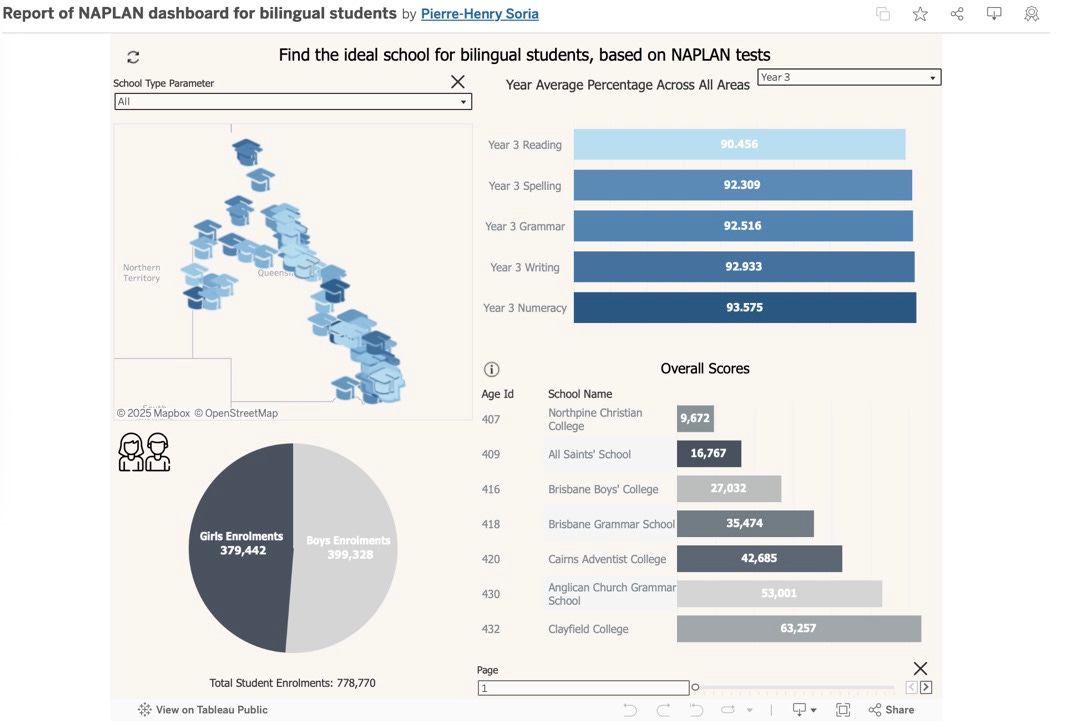
To illustrate this point, I've included both the raw dataset and the corresponding Tableau visualization I created two years ago. Notice how the visual representation immediately reveals patterns and trends that would take considerable time to identify in their raw format.
Raw Data Samples
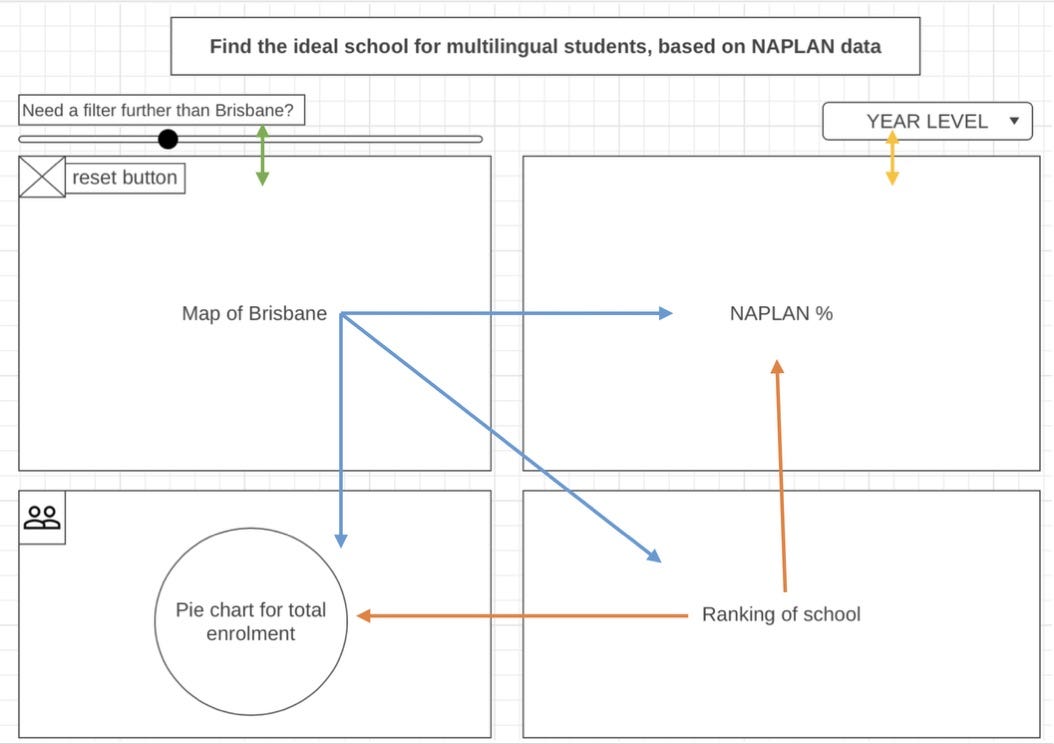
Dashboard Prototype Example (Using a Wireframe)
Tableau Visualization
The Foundation: Quality Data
However, it's crucial to remember that your visualizations are only as reliable as your underlying data. No amount of sophisticated charting can compensate for poor data quality, incomplete datasets, or incorrect assumptions. If you're not working with the right data from the start, you're setting both your models and visualizations up for failure.
This principle extends beyond visualization to all aspects of data science. Your predictive models, analytical insights, and business recommendations all depend on having clean, relevant, and accurate data as their foundation.
Moving Forward: Build Your Future
As we continue to navigate an increasingly complex data landscape, investing time in visualization skills isn't just beneficial but essential for building a successful future in data science.


